General Availability Announcement for DX Operational Observability 24.2

DX Application Performance Management

1 more products

25164

05 November 2024

05 November 2024

November 5th, 2024


To:              Customers of DX Operational Intelligence (OI), DX Application Performance Management (APM) and DX App Experience Analytics (AXA)

From:          Broadcom’s AIOps Product Team

Subject:       General Availability Announcement for DX Operational Observability 24.2


We are thrilled to announce the General Availability of our unified AIOps and Observability product with the combined release of DX Application Performance Management and DX Operational Intelligence - DX Operational Observability 24.2


DX Operational Observability brings together Broadcom’s best of the breed solutions for monitoring applications and transactions, digital experience and infrastructure. The product integrates AIOps at its core to help enterprises accelerate their digital transformation and modernization initiatives. Built on a platform hardened over decades of experience of delivering enterprise grade monitoring, DX Operational Observability aims at simplifying the operational, triage and mitigation workflows and increasing the speed of innovation within limited IT budgets. 


Benefits of DX Operational Observability 

    • Full Stack Observability: The comprehensive monitoring coverage with DX Operational Observability spans across traditional to hybrid cloud to native cloud environment to mainframe with multiple vendor support in a single tool providing unmatched observability assurance and address tool sprawl. 
    • Data democratization with access control: DX Operational Observability caters to multiple personas looking at the same data from different perspectives to foster collaboration and reduce mean time to repair. 
    • Context driven overviews: We understand that while a SRE or IT Operations might be interested in a service view to know what problem is about to occur, a subject matter expert from any domain - app, infra or network is interested in knowing where the problem is right now. DX Operational Observability provides monitored environment overviews in the context of a service, an application, end users or the entire monitored landscape to provide the relevant call to action for each persona.
    • Connected domain intelligence: To reduce the mean time to identify the issue and meet service SLAs, DX Operational Observability correlates the monitoring data across domains. Topology with time context is leveraged to automate root cause analysis and provide an all encompassing triage explorer.
    • Business context for IT problems: Prioritization of the IT problems based on their business impact is one of the key use cases for most organizations on the digital transformation journey. DX Operational Observability provides the flexibility to track end user journeys, business funnels and define SLOs and error budgets to help proactively identify the business impacting issues before they impact the end user.
    • One stop for monitoring onboarding and management: Fast and easy application onboarding, agents deployments and lifecycle management for low TCO and self-service with intuitive UI. 

DX Operational Observability enhances the existing capabilities available with DX APM, DX AXA, and DX OI with context extending across monitoring data while adding new analytics driven enhancements in this release. 


High level summary of DX Operational Observability Capabilities: 

  • Application Observability: Comprehensive monitoring across multiple application layers from frontend to mid-tier to backend for traditional as well as modern applications down to each individual transaction.
  • Infrastructure Observability: Full stack infrastructure monitoring across servers, storage, cloud, and containers at enterprise scale with consistent onboarding experience.
  • Real User Monitoring: Analytics solution to provide complete visibility into digital performance and customer experience across mobile and web applications with user journeys and business analytics funnels.
  • Service Observability: Identify the impact of IT issues on business critical services and align enterprise success factors to service SLAs.
  • AIOps (AI/ML for IT Operations): Automate issue detection, correlation, and root cause analysis to drive operational efficiencies and reduce mean time to innocence; cross-domain correlations to provide a 360-degree view of a problem for IT operations and subject matter experts with the most granular data exploration capabilities up to metrics, traces, and logs.
  • Logs: Contextual logs for monitored inventory and alarms through log ingestion support for out of the box log formats as well as custom logs.
  • Unified Dashboarding and Reporting: Out-of-the-box dashboards for different personas such as business owners, SRE, IT Operations/NOC teams, application owners, server admins, network admins, capacity planners, etc. leveraging a unified data lake capable of understanding different monitoring data (alarms, metrics, logs, events, CIs, topology, traces, thread dumps) in their native format.
  • Third-party integrations: Out-of-the-box integrations with both Broadcom and other third-party tools for data ingestion for unified observability, Ticketing and notification tools support out of the box and through APIs/webhook with automation support for collaborative operational workflows.

 Enhancement highlights for DX Operational Observability:
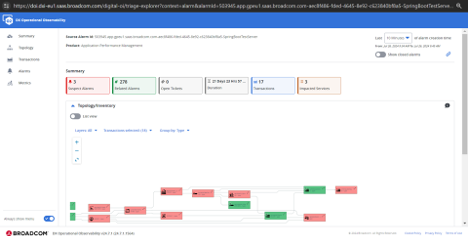
  • Triage inspector for probable root cause analysis: Fast paced impact analysis of an issue via correlated topology, performance metrics, logs, symptom and related alarms within a single view across domains. Users can take relevant actions or use contextual links to navigate to specific elements reducing the mean time to triage. 

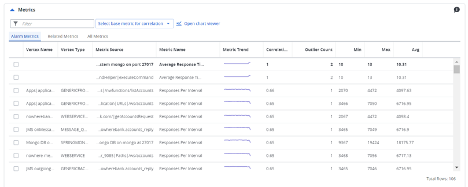
  • Metric correlation: Performance metrics may not always have an alarm definition linked but could be linked to an existing or a potential issue. Machine learning driven metric correlation helps the user answer the questions about correlated impact with evidence like correlation coefficient and metric charts. 


  • Service health configurations for proactive impact identification: The service health can be configured using alarms impacting the availability and performance. It provides the flexibility to relate service health to IT health degradation which may not always reflect in a performance metric. For example: a network service or a telco service health may be a function of fault and availability of a combination of virtual entities that reflect through an alarm. This flexibility along with the enhancement to define threshold alerting on the service health metrics from within the service definition workflow streamlines the experience for the service owners. 
  • Context carryover across workflows: DX Operational Observability provides users a continuous context across the workflows so they don't lose track of their starting points while multitasking and collaborating with other team members.  

  • Microservices (eBPF) agent for dynamic non-intrusive application monitoring: With this upgrade, the Microservices agent is also generally available. It provides a path for non-intrusive dynamic application monitoring with real-time diagnostics and troubleshooting. More details can be found here


  • Integration enhancements to strengthen operational workflows: The ticketing integrations support ticket enrichment rules and bi-directional sync for annotations to aid triaging teams in getting the right information. We launched Open Data Connector (ODC) with the last on-premise release. This release marks availability of out of the box integration support for Dynatrace, AWS and ServiceNow. These also serve as sample integrations for users to create their own using ODC. In addition, self monitoring capabilities for DX Gateway and connectors along with out of the box dashboards aims at reducing the TCO of integrations. 


  • Updates to wide application monitoring coverage for observability assurance: This release introduces the option to ingest metrics directly removing the clamps and adding increased metric throughput. Infrastructure monitoring agent (UMA) comes with liveness and readiness metrics status out of the box making self-monitoring easy for the administrators. In addition, UMA and z/OS Java agents can now be downloaded via ACC. A number of agents got updated to support the latest versions of the monitored technologies. For example, Openshift 4.15 and 4.16 support has been added and similarly for Kubernetes, the latest versions are being supported. For more details about the enhancements and upgrades for agents, checkout the product release notes for DX Operational Observability 24.2. 

This release will support in-place upgrades from versions 23.3 and 24.1. Helm charts were added to the installer from the 23.2 version onwards to make install and upgrades easier for our customers. This release further simplifies pre-qualification steps and backup and recovery procedures. 


Above mentioned are highlights of the enhancements. For details checkout the product release notes for version 24.2.


To connect, learn and share with other customers, join and participate in our DX APM Global User Community. To know more about our customer events and register, please check our customer events website. To review Broadcom Support lifecycle policies, please check the Broadcom Support Policy and Terms at https://support.broadcom.com/ by navigating to the Support Policies link. To leverage the training and education content, visit Broadcom Academy


Thank you again for your business.